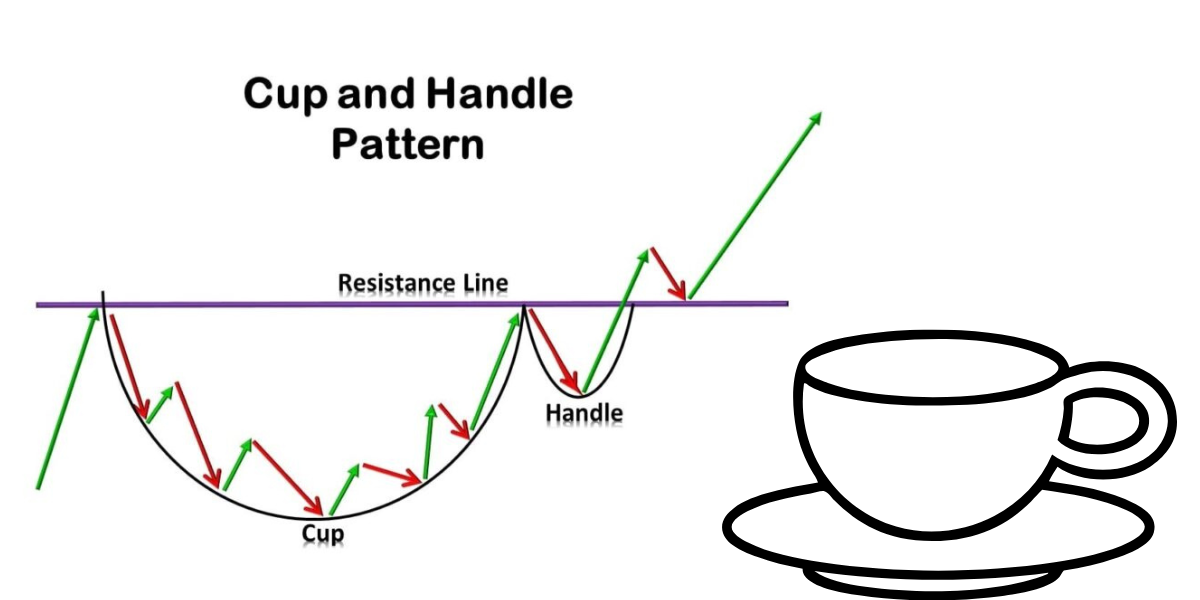
In the group of chart patterns applied to technical analysis, the Cup and Handle Pattern is generally regarded as a very reliable and profitable pattern. This pattern is used by traders and investors to find bullish trends that indicate an incredibly steep price increase of an asset (stock, currency, or commodity). Regardless of trading experience be it beginner or expert, learning the way of identifying and trading the Cup and Handle Pattern can bring excellent opportunities in the financial world.
In this full guide, we will review Cup and Handle in the detail, describing its mechanism, how to trade it and its advantages and disadvantage, how to recognize it correctly on price charts.
What is the Cup and Handle Pattern?
In fact, the Cup and Handle pattern is a technical chart pattern which is a buy signal. It is also regarded as bullish continuation pattern pattern, which will be a signal of an increase of price of an asset after pattern has been drawn up. Says the configuration consists in a roundest base (i.e., the “cup” and a short consolidation phase (i.e., the “handle” before the price is lifted abruptly with a piercing of a resistant level).
It is most commonly reported as a medium or long-term episode, of weeks or months duration. It is applied in a variety of financial markets (stocks, commodities, currencies, and cryptocurrencies).
Key Features
Thus, to understand the whole story of the Cup and Handle Pattern, one of the most important thing is knowing the components of the pattern. Here’s a breakdown of its key features:
| Phase | Description | Key Characteristics |
| 1. The Cup (Rounded Bottom) | Initial phase of the pattern, showing gradual decline followed by slow recovery. | “U” shape indicating consolidation, stable and controlled reversal. |
| 2. The Handle (Consolidation Phase) | Brief consolidation or slight downward movement after the cup. | Forms in the top half, retraces no more than one-third of the cup’s depth. |
| 3. The Breakout | Occurs when the price moves above the resistance formed at the rim of the cup. | Higher trading volume, indicating strong buyer interest and potential upward trend. |
How to Recognize the Cup and Handle Pattern on a Chart?
The Cup and Handle pattern is to be a usable, profitable pattern, so that the Cup and Handle pattern recognizable at least on price charts. Below are the key steps to spot the pattern:
- Cup Formation: Price drops and recovers, forming a “U” shape.
- Handle Formation: Short-duration consolidation alone limited to the superior third did not add one-third to the length of an intervention.
- Breakout: Price rises above resistance with increased volume.
How to Trade the Cup and Handle Pattern?
Since we are now able to identify this Cup and Handle, we are now ready to describe what should be traded preferably for this Cup and Handle.
1. Entry Point
- Buy Above Resistance: Enter just above resistance after the handle completes.
- Volume Confirmation: Ensure higher volume during breakout.
2. Target Price
- Measure Cup Depth: Find the separation between the rim and the base of the cup.
- Add Depth to Breakout: Give the target price’s breakout point more depth.
3. Stop-Loss Placement
- Stop-Loss Below Handle: Set stop-loss just below the handle’s bottom.
Advantages of the Cup and Handle
The Cup and Handle Pattern is widely used by traders, for several reasons. Below are the most important advantages of the pattern of, respectively.
1. High Success Rate
It has also been recognized as the most efficient bullish continuation pattern. Obviously, if the pattern is good, it leads to an instantaneous price’s increase and attracts them all to open a buy position.
2. Clear Entry and Exit Points
It provides clear buy and sell signals, making it easy for traders to enter and exit trades. Resistance level breakout is an excellent entry point and the price target, determined at the depth of the cup is an exit point.
3. Works Well Across Timeframes
Although the Cup and Handle typically forms over weeks or months, it can also be found on shorter timeframes. (i.e. This is also very flexible, and may be used by day trades or swing trades alike.
4. Compatible with Other Indicators
The pattern works well in combination with other technical indicators like moving averages, RSI (Relative Strength Index), or MACD (Moving Average Convergence Divergence). The combination of these metrics can enhance the pattern’s stability and validate the breakout.
Common Mistakes When Trading
The cup and handle pattern is by no means guaranteed but nevertheless there are traders who continue to be ensnared in a snare while trading the same. Here are some of the most common errors:
1. Misidentifying the Pattern
The optimal measure for trading Cup and Handle successfully is an appropriate, accurately defined Cup and Handle. It is quite common that traders mistake other chart patterns as the Cup and Handle (extension). The basin should have a curvilinear base of the cup and base of the handle should not be too traced.
2. Ignoring Volume
Volume is a critical component of the Cup and Handle. A breakout with low volume may not be sustainable. Never rely on trading volume alone to validate breakout.
3. Entering Too Early
The temptation to jump into a trade right as the cup forms is strong, however, waiting for the handle, and breakout above resistance, is critical in order to reduce risk. Entering too early could result in a false breakout.
Limitations of the Cup and Handle Pattern
The Cup and Handle is a useful instrument, but, of course, the Cup and Handle has also its drawback. Here are some things to keep in mind:
1. Time-Consuming
The construction and porganization might happen between several weeks and months, and time is needed. Traders in search of microtrade may not find this configuration to be fast enough.
2. False Breakouts
Like all technical patterns, the Cup and Handle is not foolproof. Breakout is, and will, certainly occur in markets that are hard to predict or highly volatile.
3. Requires Experience
The Cup and Handle pattern is notoriously difficult to see and interpret for a novice trader. Not overly sophisticated, it has to be learnt and practised as the journey with experience to become beneficial.
Key Differences Between the Cup and Handle Pattern and Other Chart Patterns
| Feature | Cup and Handle Pattern | Double Bottom Pattern | Head and Shoulders Pattern |
| Shape | Rounded bottom with a “U” shape | Two bottoms with a resistance level | Three peaks: left shoulder, head, right shoulder |
| Pattern Duration | Weeks to months | Several weeks | Shorter to medium-term |
| Price Movement After Breakout | Strong upward movement | Moderate upward movement | Reversal pattern (Bearish) |
| Volume Confirmation | Breakout with increased volume | Volume increases after second bottom | Decreasing volume on right shoulder |
| Type | Bullish continuation | Bullish reversal | Bearish reversal |
Conclusion
Its consistency, the relevance in professional technical analysis and repeatable making of the Stop And Go (SANDGO) pattern makes it one of the most predictable and traded chart patterns in technical analysis. Through the process of learning, through the sight of the shape and remember the shape, as well as to identify the basic parts, one will be able to train to predict the possibility of bullish trend, and how to proceed to the next step, thus the type of trader can be great power and great value.
Although the Cup and Handle has limitations in showing the boundaries, the Cup and Handle itself is far from an ideal tool, the Cup and Handle has high acceptance rates and it is delivering the right signals such that the Cup and Handle is one of the good tools in the trader’s toolbox. In the exercise, you would be able to apply these patterns to create your trading plan of the future and your best shot at any market winners.
Have a good go at it and keep in mind—patience and discipline are important when trading in technical patterns (i.e., the Cup and Handle).
Read More Blogs:)


Leave a Reply